Subscribe to see....
Race Gap Chart
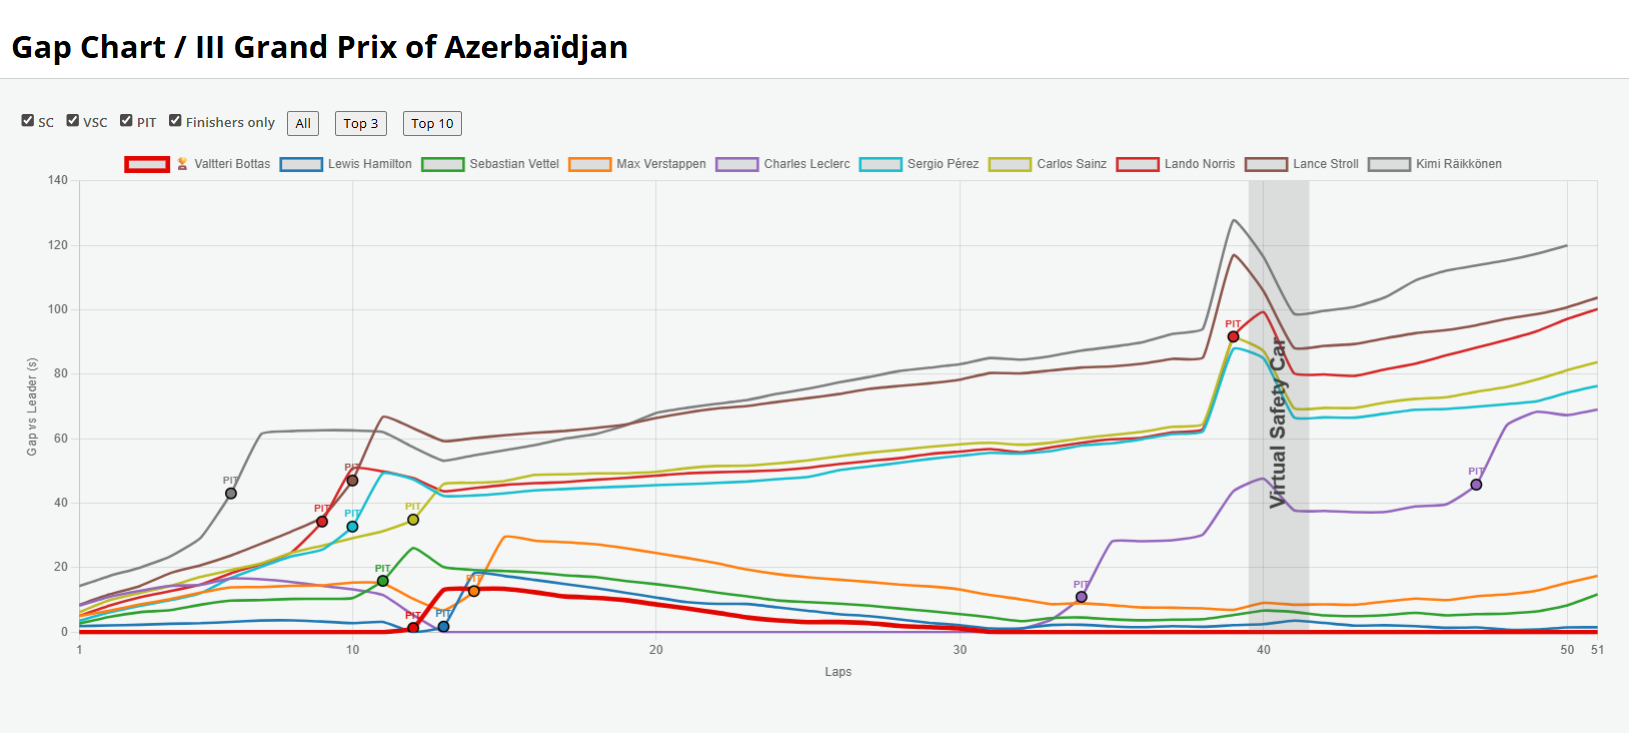
This chart displays the performance gaps between drivers throughout the race.
It provides a clear, lap-by-lap visualization of how drivers gained or lost time relative to the leader and helps identify trends, pit strategies, and the impact of safety car periods.
Driver Performance Index
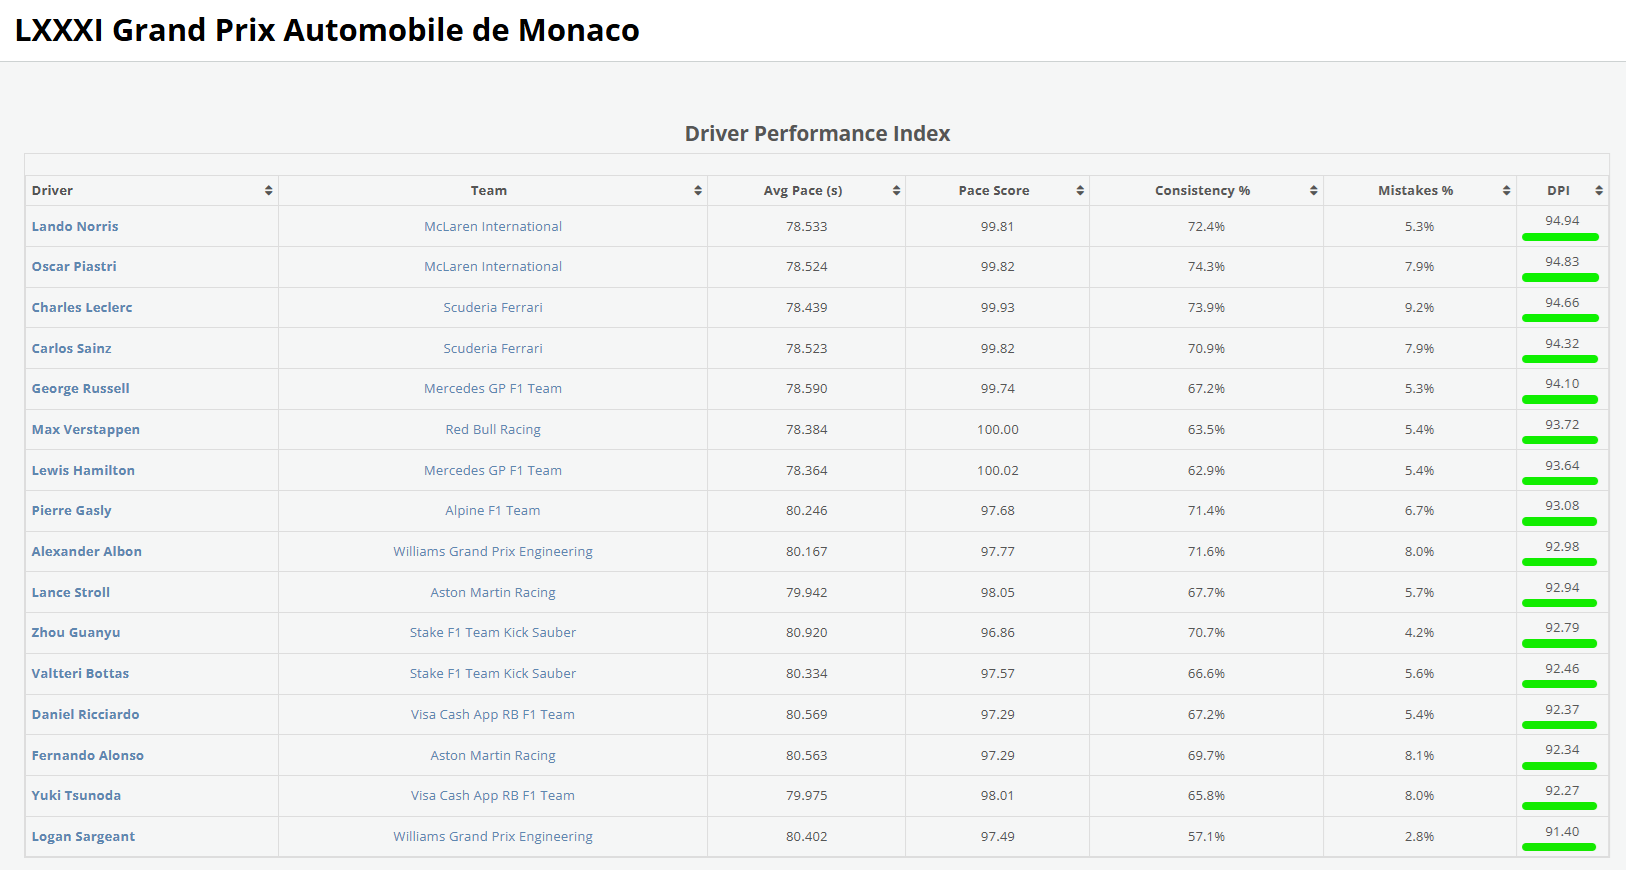
Driver Performance Index (DPI) measures a driver’s overall performance by combining three key aspects of racing: pace, consistency, and mistakes.
It provides a single score that allows direct comparison between teammates or across the grid.
The DPI score is calculated by weighting these components (typically giving more weight to pace, then consistency, and penalizing errors) to generate an overall index in the race.
Lap-Time Variation
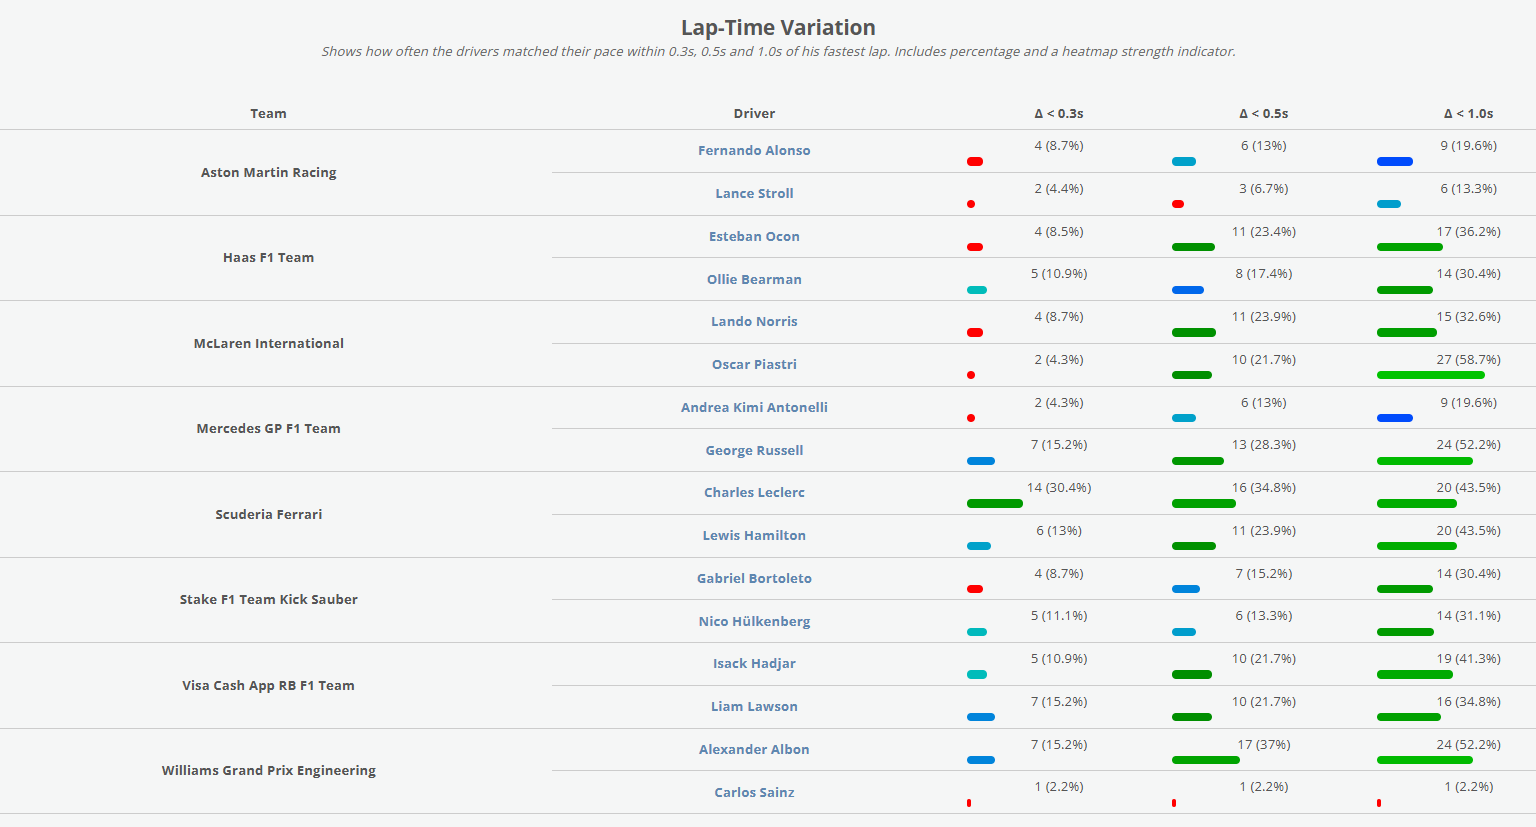
Lap-Time Variation measures how consistently a driver maintains the pace throughout a race.
It shows the number and percentage of laps completed within the margin of fastest lap time.
By looking at this data, you can quickly see if the drivers are able to consistently repeat their pace.
...and if you want to see more features, become a member and enjoy full access to premium analytics, historical data, and exclusive insights